Global Warming
A POSSIBLE ALTERNATIVE CAUSE FOR
ATMOSPHERIC CARBON DIOXIDE INCREASE
Argus C. Zall
(Copyright 10/1/02; All Rights Reserved)
Abstract From available flux data (1,2), simple algebra, and the assumption that uptake by the environment increases with atmospheric concentration of CO2, it is deduced that the capacity of the biosphere to absorb CO2 has been substantially degraded relative to its emissions thereof since pre-industrial times. It is further concluded that the loss of ability of the global ecosystem to absorb its own natural emanations is a very large contributor to the increase in atmospheric CO2 concentrations, with anthropogenic CO2 playing a secondary role. The principal cause of this degradation is suggested to be human perturbation of the oceanic ecosystem by overfishing and pollution.
Introduction The Kyoto Convention (1997) adopted the view that the increase in atmospheric CO2 concentration since the pre-industrial age is entirely due to anthropogenic emission of CO2, a greenhouse gas. It emphasized that since the last ice age, the atmospheric concentration of CO2 had been more-or-less stable at about 280 ppm, until the beginning of the industrial age, when it began to and continues to rise at an ever-increasing rate, to its present level of ca 370 ppm. It proposed that the world community should in concert reduce global emissions of this greenhouse gas to their 1990 levels by the year 2010. Although this will amount to nearly a 20% reduction in emissions per capita, it is clear that this could be no more than a first step in meeting the ultimate objective of limiting the eventual (stable) concentration of this and other greenhouse gases to no more than twice their pre-industrial levels (560 vs. 280 ppm for CO2). This is the maximum level deemed to be tolerable by climate models if catastrophic increases in global temperatures are to be avoided.
In this work, I would like to draw attention to a different human impact on the environment which appears to be of at least equal if not greater importance as anthropogenic emissions in bringing about the rise in atmospheric CO2 concentration, and which if not corrected will largely negate any beneficial effect of achieving all the targets of the Kyoto Convention.
Since the end of the Kyoto Conference there has been much additional study of global carbon reservoirs, fluxes, and balances. Two of these (1: M. Battle et al., Science 287, 2467 (2000); 2. P. Falkowski et al., Science 290, 291 (2000)) have been particularly useful in providing values for the natural and anthropogenic emission and absorption fluxes. I have made use of these data in a simple analysis with a single hypothesis that results in the conclusion that the biosphere has lost since preindustrial times a significant fraction of its ability to absorb its own natural emissions, and that this loss is linearly proportional to the global human population. This loss appears to be sufficient to have caused much of the atmospheric concentration increase, independent of any human emissions of CO2. As I will show, the conclusion is quite insensitive to the details of the multiplicity of natural processes involved. Having established these points, I will then propose that despoilation of the oceans, principally through overfishing, is a major cause of the problem.
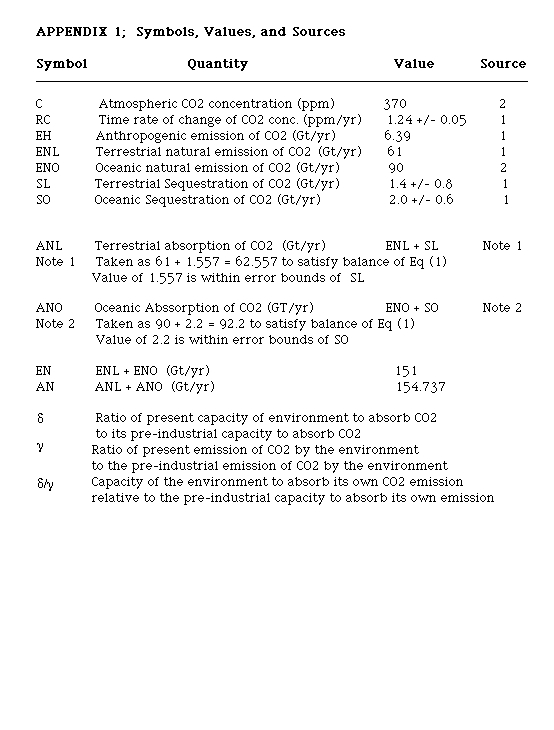
The Analysis: I will make use of an equation of continuity relating the time-rate-of-change of atmospheric CO2 concentration to the several emission (E) and absorption (A) fluxes. Natural fluxes are designated by added N, human fluxes by the added H. Add-ons L and O refer to land and ocean respectively. For a description of the symbols and the magnitudes of their corresponding quantities, see Appendix I. Since the blog editor does not support superscripts, subscripts, or Greek-letter symbols, all equations are lumped into .PNG inserts (Eqs 1-8 on Insert 1, immediately following; Eqs 9-12 on Insert 2, just before “Cause of the Degradation”) and are referred to by number only in the text. I apologize for this inconvenience.
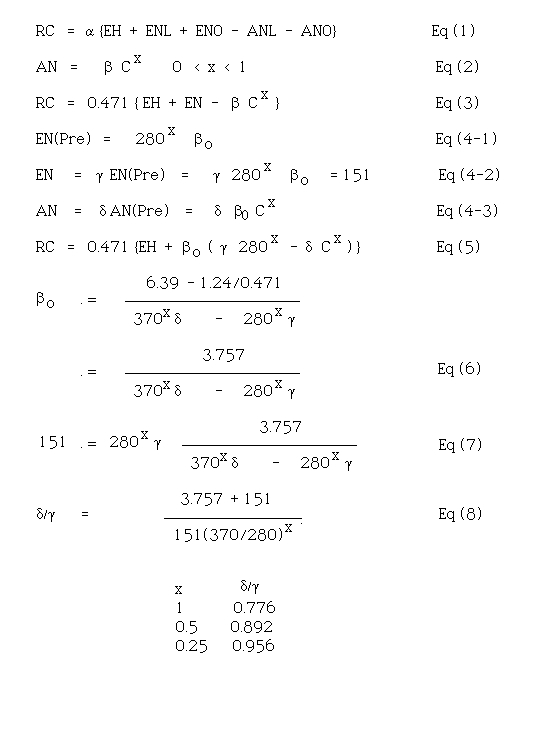
Equation Insert 1
Equation (1)
In considering Eq (1), I will use annualized average fluxes, ignoring the seasonal variations. Emission and absorption fluxes are given in gigatonnes/yr (Gt/yr) while RC is in ppm/yr. The coefficient alpha is a conversion factor, and equals 0.4711. I will lump all natural emissions together and all natural absorptions together and make the hypothesis that absorption increases with atmospheric concentration C (ppm), with a coefficient beta, as follows
Equation (2)
The many processes by which the terrestrial and marine biospheres absorb CO2 from the atmosphere have been under intensive study in the years since the Kyoto Convention2. Each of them, no doubt, has a different dependence of absorption rate on atmospheric concentration. It is not the purpose of this work to discuss them in detail; rather, I wish to focus on a broad overview, treating Eq(2) as an empirical global average over all processes. Considering Eq(2) as a grand average, then, and not specifying a value for the exponent “x”, I will only draw conclusions that are valid across a large range of values of x, and hence are insensitive to the details of those processes.
Figure 1 illustrates the assumed dependencies of relative CO2 absorption by the global biosphere on atmospheric CO2 concentration for x = 0.25, 0.5, and 1.0, normalized to the value at 280 ppm, the pre-industrial steady-state. It is clear that x must be greater than zero, or else no steady state atmospheric concentration of CO2 could have ever been achieved. If absorption were completely independent of atmospheric concentration, C would be either increasing or decreasing continually unless by happenstance emission and absorption were independently the same. Moreover, for x < 0.25, long–term steady states would be unlikely, because relatively minor changes in emission would require relatively large changes in atmospheric concentration to restore equilibrium. Similarly, values of x > 1 are unlikely as a global average, because in at least some of the CO2 absorption processes other factors than concentration are rate-limiting. As I will subsequently show, the conclusion I draw is valid over the range of x-values encompassed in Fig 1, between 0.25 and 1. This represents a very broad range of possible values of relative absorption for a given concentration, and of values of concentration required to balance a given emission. For the conclusion to be valid over such a range of possibilities means that it is quite insensitive to the details of the multiplicity of processes involved.
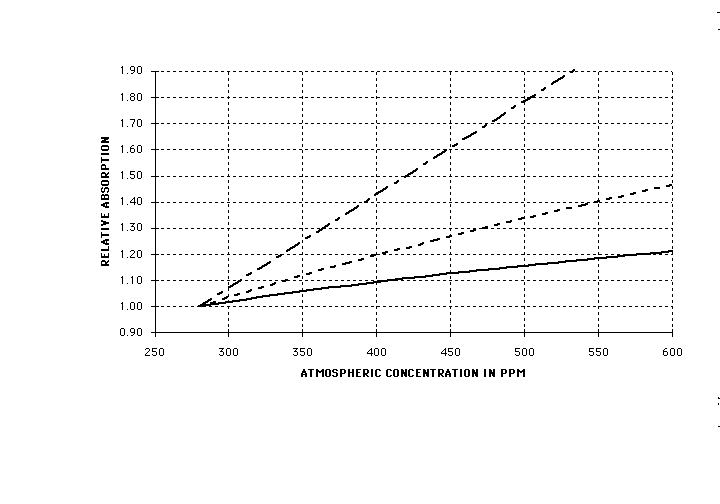
Fig (1) Assumed absorption of CO2 by the biosphere from the atmosphere, normalized to its value at 280 ppm as a function of atmospheric concentration for several values of exponent “x” in Eq (2). Solid line, x = 0.25; dashed line, x = 0.5; dot-dash line, x = 1.
Substituting from Eq(2) into Eq (1) gives
Equation (3)
In the pre-industrial period, RC, EH = 0, C = 280 ppm. Thus, we may solve for EN(Pre), the natural emission of CO2 in pre-industrial times, in terms of beta-0 the proportionality constant at that time.
Equation (4-1)
In the modern era, the emanations and uptake of CO2 are no doubt different from their preindustrial values
Equation (4-2)
Equation (4-3)
in which gamma and delta are unknown factors different from unity.
Accordingly, we can rewrite Eq (4) for the modern era as:
Equation (5)
with gamma and delta the unknown ratios accounting for the difference between current natural emissions and absorptions and their preindustrial values.
Solve for beta-0, the preindustrial proportionality constant , using the current values for RC, EH and C, from Appendix 1
Equation (6)
We note that the result for beta-0 is dependent on both the unknown ratios delta and gamma. However, we may use the value of present-day natural emissions, E N = 151 Gt/yr, equal to gamma times (280 to the power x) times beta-0
Equation (7)
Gather terms and solve for delta / gamma, obtaining
Equation (8)
Solving this equation for various values of x gives delta/gamma equal to 0.776, 0.892, and 0.956, fro x equal 1, 0.5, and 0.25, respectively.
Approximately delta / gamma = 1 – 0.224 x
delta is the ratio of current beta to preindustrial beta-0 and is a measure of the capacity of the biosphere to absorb CO2 relative to its capacity in preindustrial times. gamma is the ratio of current natural exhalations of CO2 by the biosphere relative to the value in preindustrial times. Therefore the ratio delta / gamma is a measure of the capacity of the biosphere to absorb its own natural emanations of CO2 relative to the preindustrial multi-century equilibrium. Regardless of the assumed value of x, we see that the ratio delta / gamma is less than unity, ie that the capacity of the biosphere to absorb its own natural emanations has been degraded relative to its preindustrial value. I note that there is not sufficient information to determine the independent values of delta or gamma The ratio delta / gamma could decrease if either delta was less than unity or if gamma was greater than unity. Thus the observed decrease of delta / gamma could result from a variety of different processes.
It is of interest to determine the steady-state level to which atmospheric concentration of CO2 would have risen in response to anthropogenic emissions had there been no degradation of the capacity to absorb. This we can do from Eq(5), with the substitution from Eq(4-2) of a value for beta-0 .
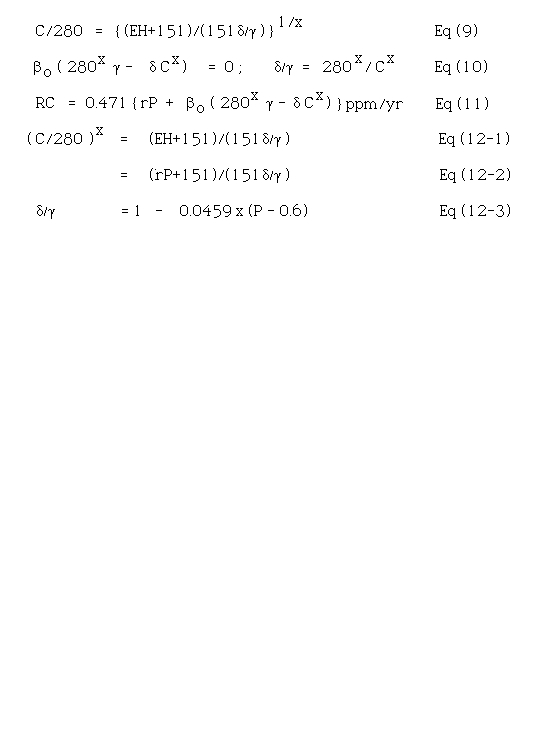
Equation Insert 2
beta-0 = {(151/280) to the power x} times gamma
Substituting in Eq(5), setting RC = 0 and solving for concentration C gives
Equation (9)
With the current value of EH = 6.39, and with delta / gamma = 1, this gives 292 ppm, 304 ppm, and 330 ppm for x = 1, 0.5, and 0.25 respectively, all far less than the actual present value of 370 ppm.
The conclusion of this elementary analysis is that a major cause of the increase in atmospheric CO2 concentration to 370 ppm during the industrial era is the substantial reduction in the capacity of the global ecosystem to reabsorb its own CO2 emissions. The relatively minor (4%) contribution of anthropogenic emissions seems to play only a secondary role. The conclusion remains robust over a range of functional dependencies of absorption on atmospheric CO2 concentrations, from proportional to a one-quarter power dependence, and is therefore quite insensitive to the details of the contributing processes. If this is indeed correct, The Kyoto Convention focus on anthropogenic CO2 emissions alone is overlooking a significant part of the problem.
Cause of the Degradation. I propose that the principal source of this degradation of the ability of the biosphere to absorb carbon lies in the oceans. Sarmiento and Gruber (3; J. L. Sarmiento and N. Gruber, Physics Today, (Aug 2002) pp 30-36) have published an analysis of the carbon storage in oceanic and atmospheric reservoirs of carbon, and of the annual fluxes between them. Their results for the present era are summarized in Fig 2, in which reservoir sizes are given in gigatonnes (1 gigatonne = 1 petagram), and fluxes are given in gigatonnes per year. The time constants for exchange of carbon between surface ocean and atmosphere are months to years; for exchange between surface ocean and marine biota, years to a decade or so; for storage in the deep ocean, centuries to millennia. Thus, the significant export (11 Gt/yr) from marine biota to the deep ocean can be considered, on the time-scale of human influence, essentially as sequestration.
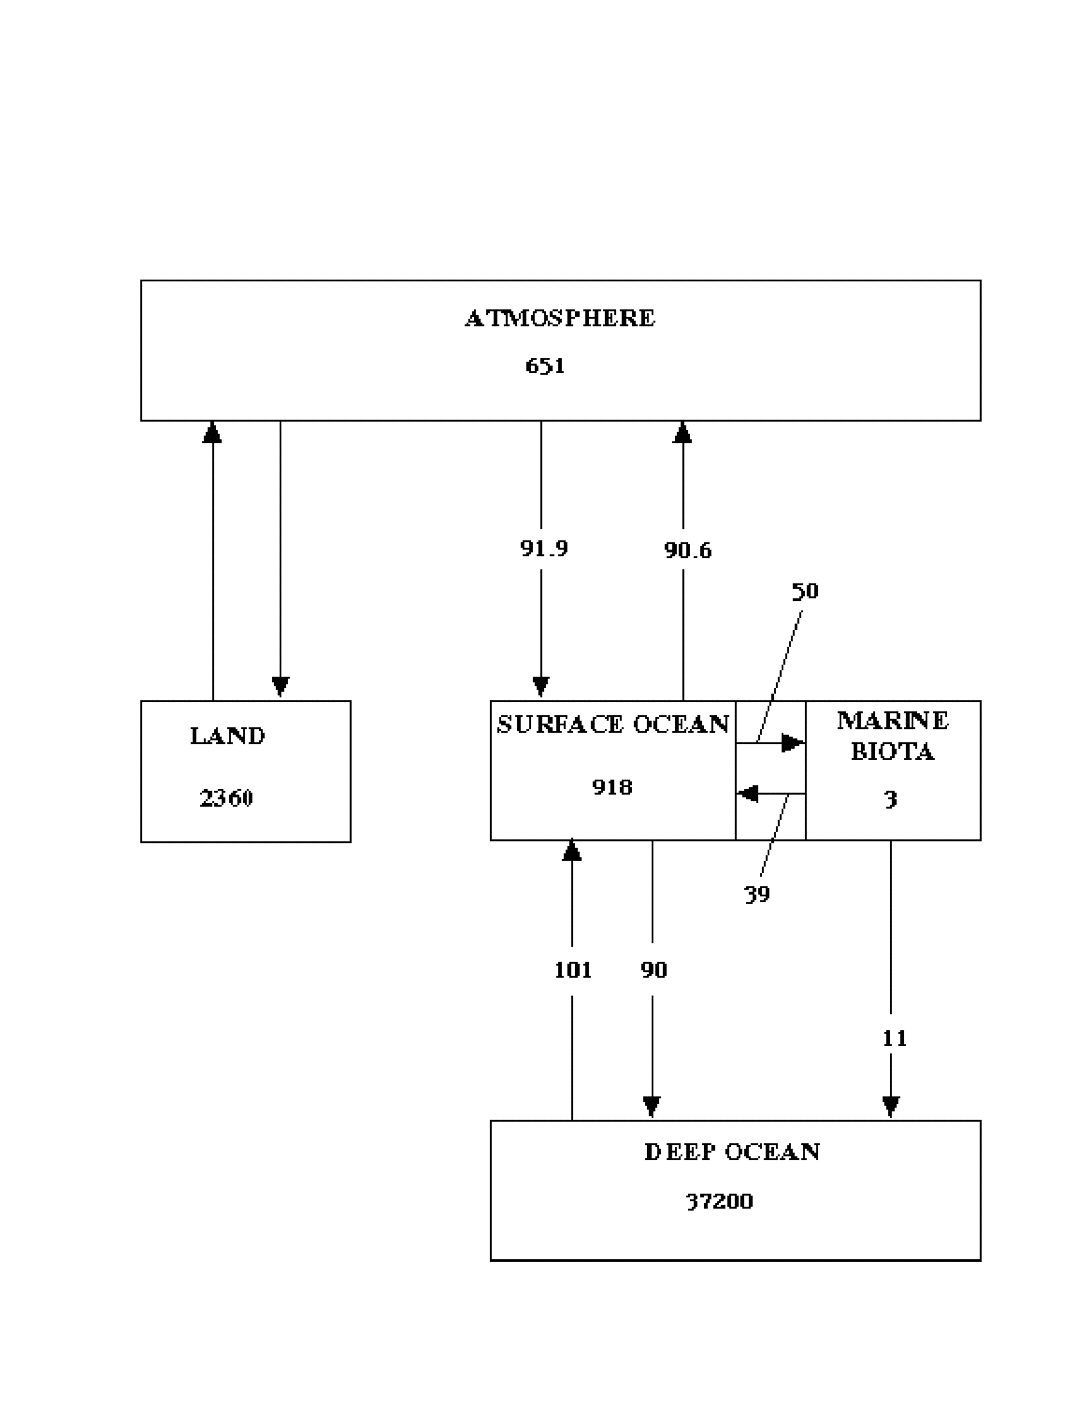
Fig (2) Estimated sizes of oceanic carbon reservoirs and fluxes to and from them, as of the present, according to 3). Reservoir sizes given in gigatonnes (Gt), fluxes in Gt/yr
Sarmiento and Gruber also estimate changes in the values of some of the reservoirs and fluxes since the preindustrial era. Their values are shown for the preindustrial era in Fig 3. Most surprisingly, and I believe erroneously, they do not consider the reservoir of marine biota or the fluxes to and from it to have changed at all! I believe that this reservoir has been substantially changed by human activities since the preindustrial era, and continues to be increasingly pillaged and degraded. A review of the data presented in the “State of Fisheries and Aquaculture” (SOFIA-2000) of the Food and Agriculture Organization of the UN (www.fao.org) reveals a sad tale of world-wide overstressing, depletion, and near-extinction of fish stocks. Between 1969 and 1997, not only did the technology of fishing vastly improve, but employment in the fisheries trade tripled; however, the total fish production increased by only a factor of two, and half of the increase was in aquaculture. It took three times the effort to catch fifty percent more fish; even this increase was the result of fishing further down into the chain, harvesting fish previously not considered of commercial value. Over this span of time, the reservoir from which the catch was taken must have decreased by at least 30%.

Fig (3) Estimated sizes of oceanic carbon reservoirs and fluxes to and from them, in preindustrial times. Plain test, estimates according to 3); italics, estimates as proposed herein, to account for despoilation of fisheries since preindustrial times.
Anecdotal evidence of the depletion of fisheries also abounds. The average size of swordfish landed by long-liners on the East Coast of the US has decreased by half in twenty years. Codfishing grounds previously thought to be inexhaustible have been closed. Whale populations have decreased an order of magnitude since the heyday of the Nantucket and New Bedford whalers. And so on, et cetera, und so weiter. In a word, no commercially-useful fish dies of old age anymore. While the biomass of vertebrate predator species is only a small fraction of that of plankton, I would argue that it took twice the biomass of plankton prey to support twice the biomass of predators. Moreover, the drastic reduction in the population of vertebrate predators has opened an ecological window for invertebrate jellyfish, which now consume half of the plankton. (6. R. Connuff, “Jelly Bellies”; National Geographic (June 2000)) As those who live by the seashore know, jellyfish carcasses float rather than sink. Thus they decompose in the oxidic upper layers of the ocean, returning their carbon to the water as carbon dioxide.
Accordingly, I think it is entirely reasonable to postulate that the size, and fluxes to and from, the marine biota reservoir in Fig 3 were actually twice as great in preindustrial times as they are today. These revised estimates are shown in italics in Fig 3. With these changes, the flux exported from marine biota to the deep ocean (sequestered!!!) was 22 Gt/yr in preindustrial times, 11 Gt/yr greater than at present.
The flux from atmosphere to surface ocean is dissolving CO2. The flux from surface ocean to atmosphere is exsolving CO2. The former was much smaller in preindustrial times because of the lower concentration in the atmosphere. The fact that the latter was also smaller in preindustrial times must mean that the concentration of dissolved CO2 in the surface ocean was also smaller, since exsolvation will be proportional to concentration. That is, although the total size of the surface ocean reservoir was about the same, the fraction of it in the form of dissolved CO2 was smaller. This is entirely consistent with depletion of dissolved CO2 by the increased photosynthetic activity required by the larger biological productivity needed to sustain the larger biomass. Thus, the larger flux of dead biomass to the deep ocean exerted a net drain on dissolved CO2 and required solution of more from the atmosphere, pulling down the concentration in the atmosphere..
Consequently, this line of reasoning would lead one to conclude that human activity has reduced the flux of carbon from dead biomass to the deep ocean from 22 Gt/yr to 11 Gt/yr. This loss of an 11 Gt/yr sink would have had at least as great, perhaps double, the effect on atmospheric concentrations as the addition of 6 Gt/yr anthropogenic emission of carbon by fossil fuel combustion. Therefore, this mechanism seems entirely capable of accounting for the reduction calculated above in the ability of the biosphere to absorb even its own emanations.
Application to the past. It is instructive to use the estimated decrease in delta / gamma to analyze the increase in atmospheric CO2 concentration since about 1850. I have assumed that natural emissions and absorptions dominate and are always in approximate balance. Since anthropogenic CO2 emission was much smaller than even a few percent before the latter quarter of the twentieth century, this approximation is reasonably satisfactory. The slow increase in atmospheric concentration then is the result of continuing degradation of the biosphere capacity to absorb the natural emanations. Thus
Equation (10)
Figure 4 is the time series of the resultant values of the decrease in bioabsorption, (1 – delta / gamma)/x, plotted against the corresponding time series for global population. C-values are taken from reference 4, (4; S. B. Idso, Carbon Dioxide and Global Change: Earth in Transition, 7, IBR Press (1989)) while population data are from reference 5. (5; M. S. Huffman, Ed., World Almanac and Book of Facts 1991, 503, Pharos Books, New York, NY (1991)). Striking is the fact that the degradation (1 – delta/gamma)/x is linearly proportional to population above a threshold value of 0.6 billion (approximately the global population of the pre-industrial age). Data for all three values of x tested, 1, 0.5, 0.25 fall on one curve, which is fitted by the function 0.0459(P-0.6), the solid line in Fig 2.
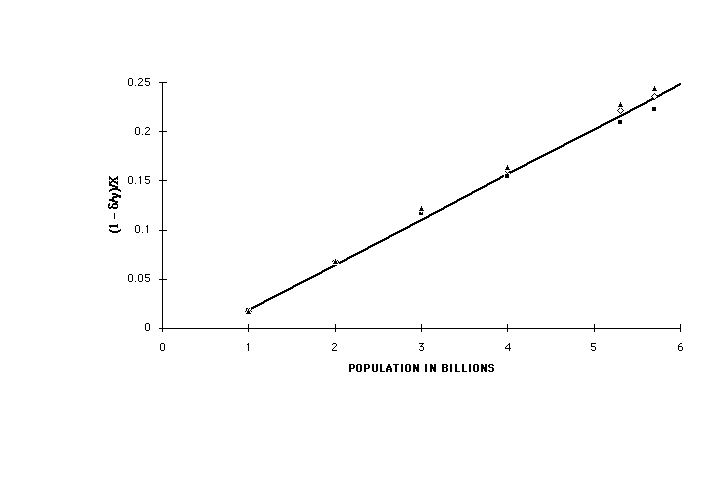
Fig (4) 1 – delta / gamma from Eq(10) (plotted as (1 – delta / gamma)/x) versus the world population in billions for the same year. Points: data; solid squares, x = 1; open diamonds, x = 0.5; solid triangles, x = 0.25; the line is (1 – delta / gamma)/x= 0.0459(P-0.6), showing that the degradation is approximately proportional to population above a threshold. Data points for x = 1, 0.5, and 0.25 all fall on the same line.
Application to the future. We can project these results into the future by rewriting Eq(5) as follows
Equation (11)
in which P is the global population in billions, and r is the per-capita release of CO2 in gigatonnes per year per billion (presently approximately = 1). Since RC is quite small, for simplicity I will assume it to be zero. delta / gamma is taken according to the finding of Fig 2, delta / gamma = 1-0.0459x(P-0.6). Then from Eq(9):
Equation (12-1)
Equation (12-2)
Equation (12-3)
Figure 5 is a plot of the solutions of Eqs(12) for C versus world population in billions for two different values of r: 1 (no change) and 0.5 (major reduction in per-capita emission), for x = 1 and x = 0.25. At a population of 10 billion, expected to be reached by 2050, all of these exceed 500 ppm, with at most 60-70 ppm difference between r = 1 and r = 0.5. Figure 6 is a plot of the value of C at 10 billion population for r = 1 and r = 0.5 as a function of the value of the assumed exponent x. As long as degradation of the capacity of the biosphere to absorb its own CO2 emissions continues to grow with population at the same rate as in the past, atmospheric concentration will continue to rise, and will be affected only slightly by heroic and near-catastrophic efforts to limit per-capita anthropogenic emissions. Achieving the targets of the Kyoto Convention, amounting to a 20% reduction in per capita emissions, would appear to produce only some 20 ppm difference. Because of the wide range of functional dependencies of absorption on C over which the conclusion holds, it is quite insensitive to the details of the processes involved.
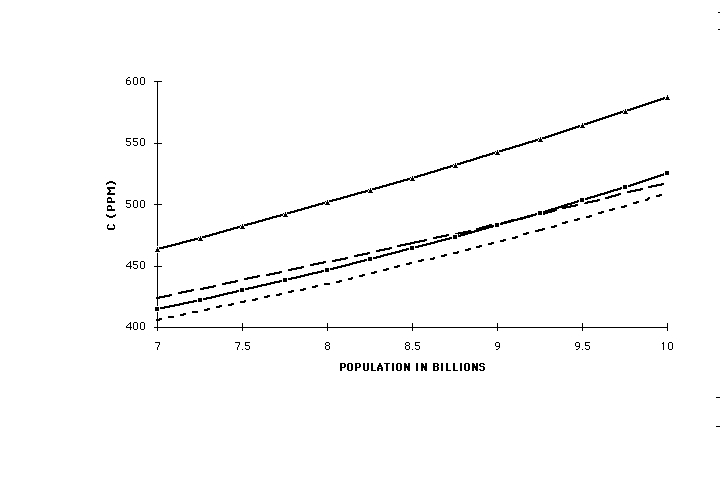
Fig (5) C from Eq(12) versus population in billions, assuming delta/gamma according to Fig(4) Solid line: per-capita CO2 release r assumed unchanged at 1 Gt/yr per billion; dashed lines, r = 0.5. Solid squares, per capita human emission unchanged at r = 1, short-dashed line, r = 0.5, both at x = 1. Solid triangles, per capita human emission unchanged at r = 1, long-dashed line, r = 0.5, both at x = 0.25. Projected to future population of 10 billion, expected to be reached in 2050.
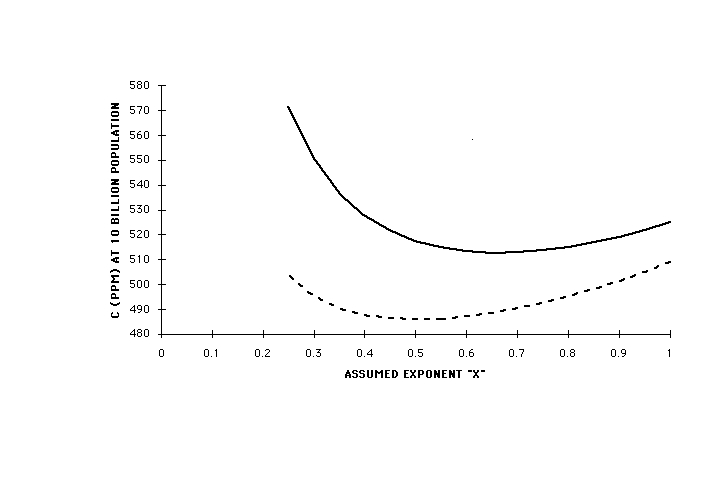
Fig (6) C from Eq(12) for world population of 10 billion vs. value of assumed exponent x. Solid line, r = 1, no change in per-capita anthropogenic CO2 emission; dashed line, r = 0.5, 50% reduction in per-capita anthropogenic CO2 emission. Independent of the value of x, all of these are greater than 480 ppm, with only slight dependence on the per-capita emission.
Discussion and Conclusion. If these conclusions are correct, a program to reduce anthropogenic CO2 emissions will have only small effect unless there is a simultaneous effort to repair the damage to the ocean ecosystem. In fact, it can be argued that the most effective way of halting or even reversing the rise of atmospheric CO2 concentrations would be to prohibit completely all harvesting of ocean biomass. The time span for recovery of the biomass stocks, and of their export of carbon to the deep ocean, could be as little as a few decades, at an economic cost far less than that which would be required to reduce CO2 emissions per capita by 50%. Since much of the edible sea-food supply is produced by aquaculture even today, expansion of this effort could supply the world requirement for those nutritional values. However, the fish-meal presently used for feedstocks would have to be replaced by other sources: possibly phtyo- and zoo-plankton also farmed on site. Successful achievement of ocean recovery could give the world centuries, if not millennia, of grace in which to wean economies away from fossil-fuel based energy supplies.
June 7th, 2012 at 6:46 pm
A lot of thanks for all of the work on this site. Ellie really likes participating in research and it’s simple to grasp why. Most people learn all about the dynamic tactic you provide functional guidelines via this blog and therefore improve participation from some others about this concept plus our favorite simple princess is actually being taught so much. Take pleasure in the rest of the new year. You are always conducting a terrific job.